Much of the work of a study can be done prior obtaining the latest new information.
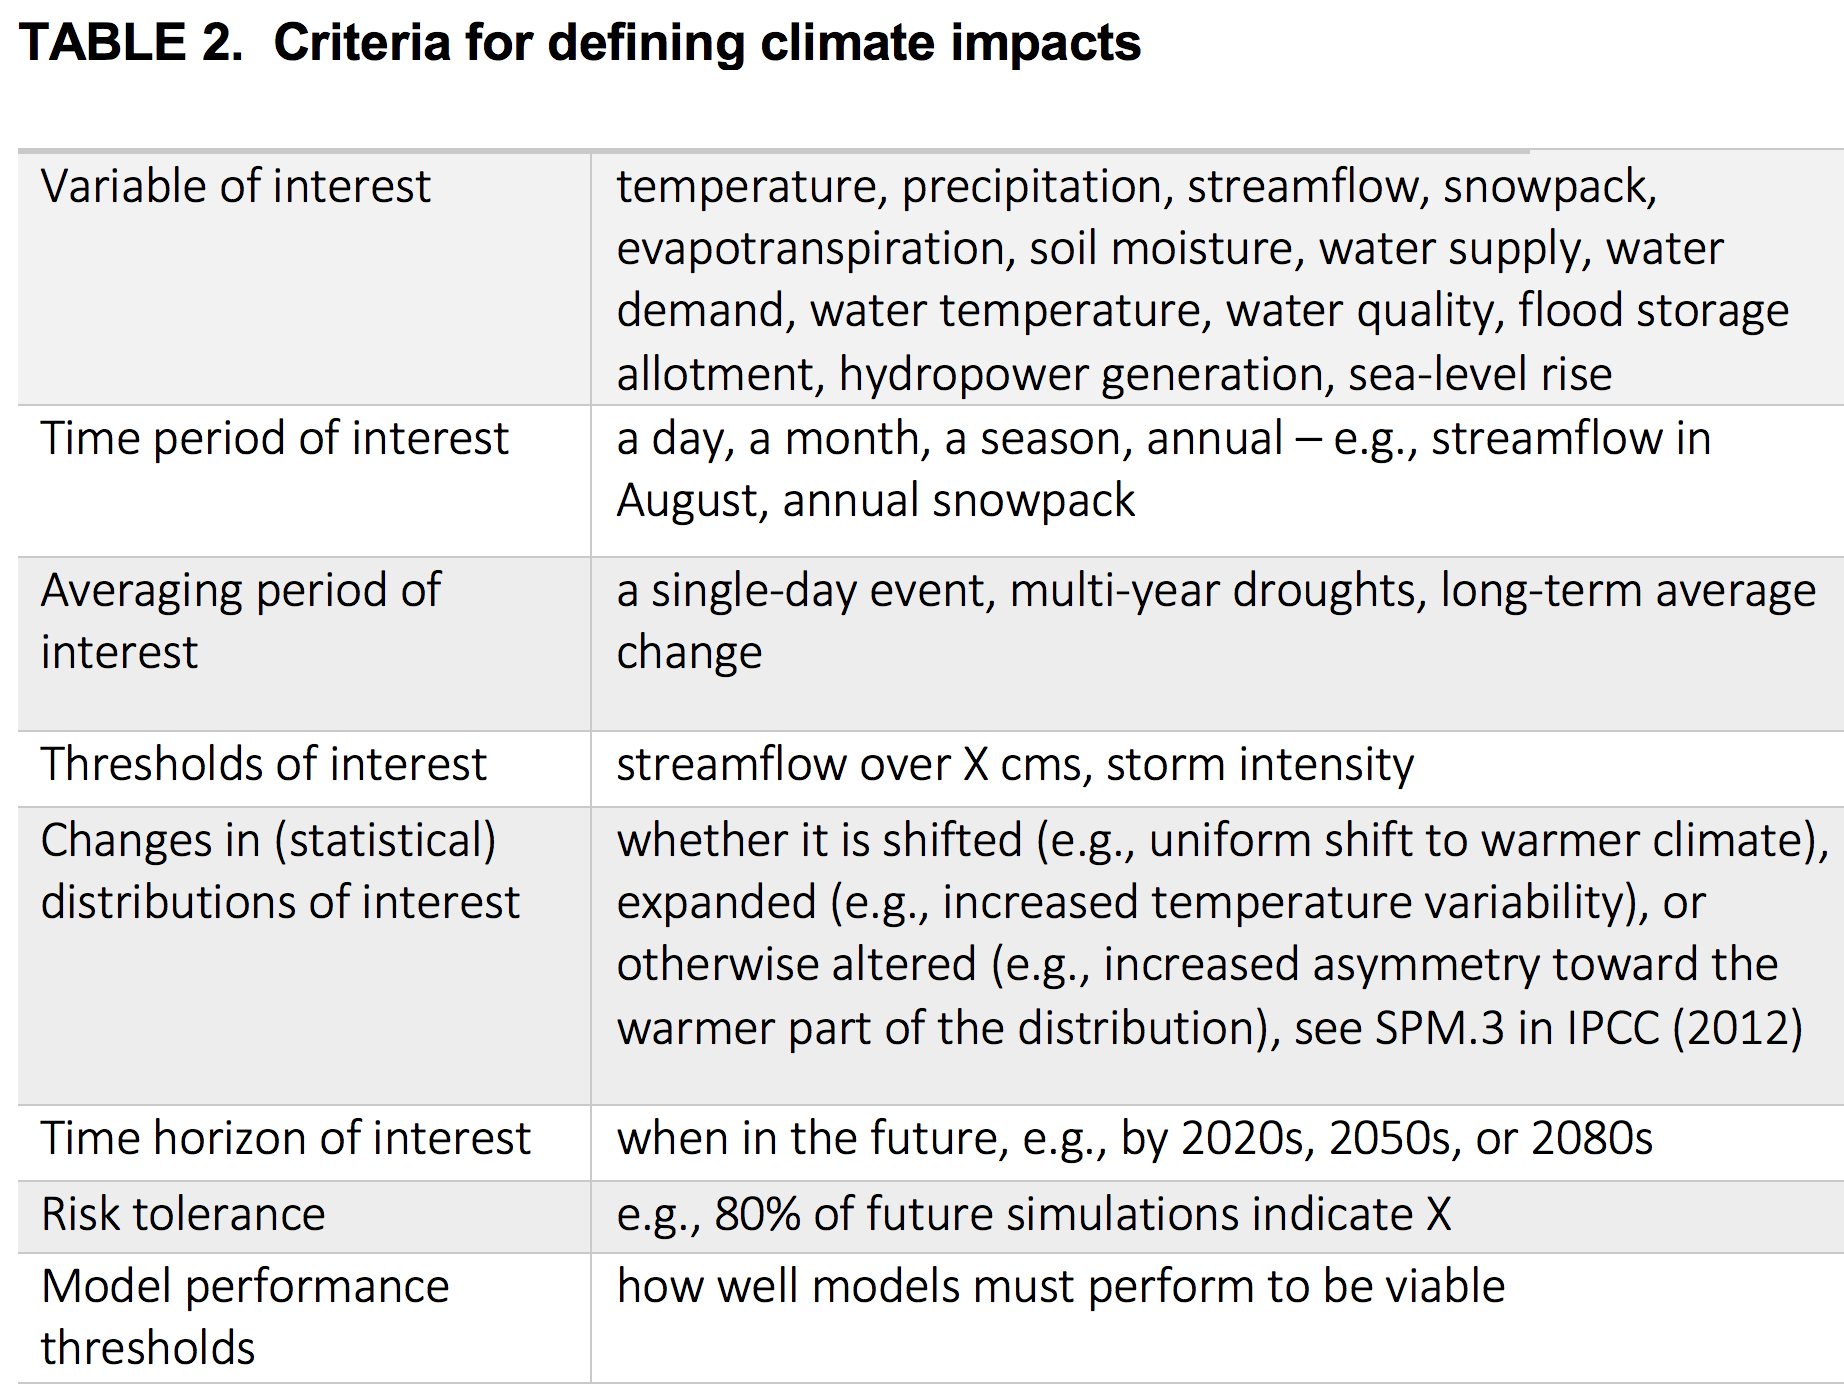
moreClimate change evaluations for water resource planning and management usually require data processing and linking one model’s output to the next model’s input (Reclamation 2016; Brekke et al. 2009). Therefore, setting up and running the model chain in its entirety with a single simulation is arguably a large portion of the work, especially if processes can be automated. Each step can have unforeseen challenges, and important lessons that might reshape how project goals are achieved. For example, having preliminary numbers to work with can help refine evaluation criteria (Table 2). Early feedback on how the information is shared can prevent time being wasted creating information that is not useful. Additionally, in many cases, the newest climate change projections provide similar trends to earlier versions and can be useful for preliminary evaluations.
Earlier consideration of climate impacts has the potential to save resources, as it is easier to consider climate impacts during the design phase of a project than to restructure mature facilities (PIEVC 2008).
Learn more about: the importance of iterations ; evaluation criteria• learning where and how to download the data
• using unfamiliar data formats (e.g., NetCDF)
• slicing data for a particular region or time period
• converting from one data format to another
• automating the process
• running a model with new, more extreme inputs, can create unforeseen errors
• defining evaluation criteria (see Table 2 below)
• displaying results in meaningful ways
Climate Model Intercomparison Projects (CMIP) 3 and 5 contain archives of future climate projections that differ in: number of models, the model versions, and their emission levels. Regional comparisons show some differences (e.g., Knutti and Sedláček 2013; Sun et al. 2015; Rupp et al. 2016). However, both datasets capture the global-scale features (temperature and precipitation changes) of climate change similarly (Rogelj et al. 2012; Knutti and Sedláček 2013; Sun et al. 2015). As such, at a IPCC Expert Meeting on Assessing and Combining Multi Model Climate Projections CMIP5 is seen as an addition to rather than a replacement of CMIP3 (Knutti et al. 2010a; https://gdo-dcp.ucllnl.org).
Learn more about: a forthcoming DO on how to navigate differences between climate scenariosThe first time going through all the steps in the modeling chain can reveal the need for changes in earlier steps, as experienced in the WACCIA. The goal of this assessment was to update climate change projections and use them to assess climate impacts on nine key sectors in the state of Washington, including hydrology and water resources (Elsner et al. 2010; Vano et al. 2010a,b). The assessment used a chain of models approach that used output from 20 global climate models, two emission levels, for three future periods, downscaled, run through a hydrologic model, then run through a reservoir operations model to assess impacts. In the first year of the project, when simulations were run through reservoir operation models, unforeseen errors arose. First, the team realized their configuration of the disaggregation of monthly to daily data contained unrealistic daily precipitation estimates that were artifacts of the subsampling – in short, a few isolated storms in dry months were sampled too frequently in wet months. This discovery prompted a reconsideration of the downscaling technique and a delta method was used instead. These challenges are described in Hamlet et al. (2011) along with a new downscaling technique designed to overcome these challenges in future work. Second, new streamflow conditions required several alterations to the reservoir models that would enable them to continue to run during unprecedented extremes (e.g., extending the interpolation of anticipated flow values in September). Modifications were possible (e.g., described in Vano et al. (2010b)), but required considerations best not left until the end of the project.
This example illustrates the value of making it all the way through the modeling chain prior to completing all simulations at a single step. Additionally, more extreme projections can cause impact models to fail because they were designed only to evaluate more moderate conditions. Traversing the entire modeling chain as soon as possible in the project can be useful in uncovering necessary model modifications early on (Vano et al. 2010b).
Begin evaluating your impact with the information that is currently available, with the mindset that more information will be coming. Set up interim products that can test the process and, if appropriate, give information users an opportunity to provide early feedback.
3450 Mitchell Ln
Boulder, Colorado 80301
United States